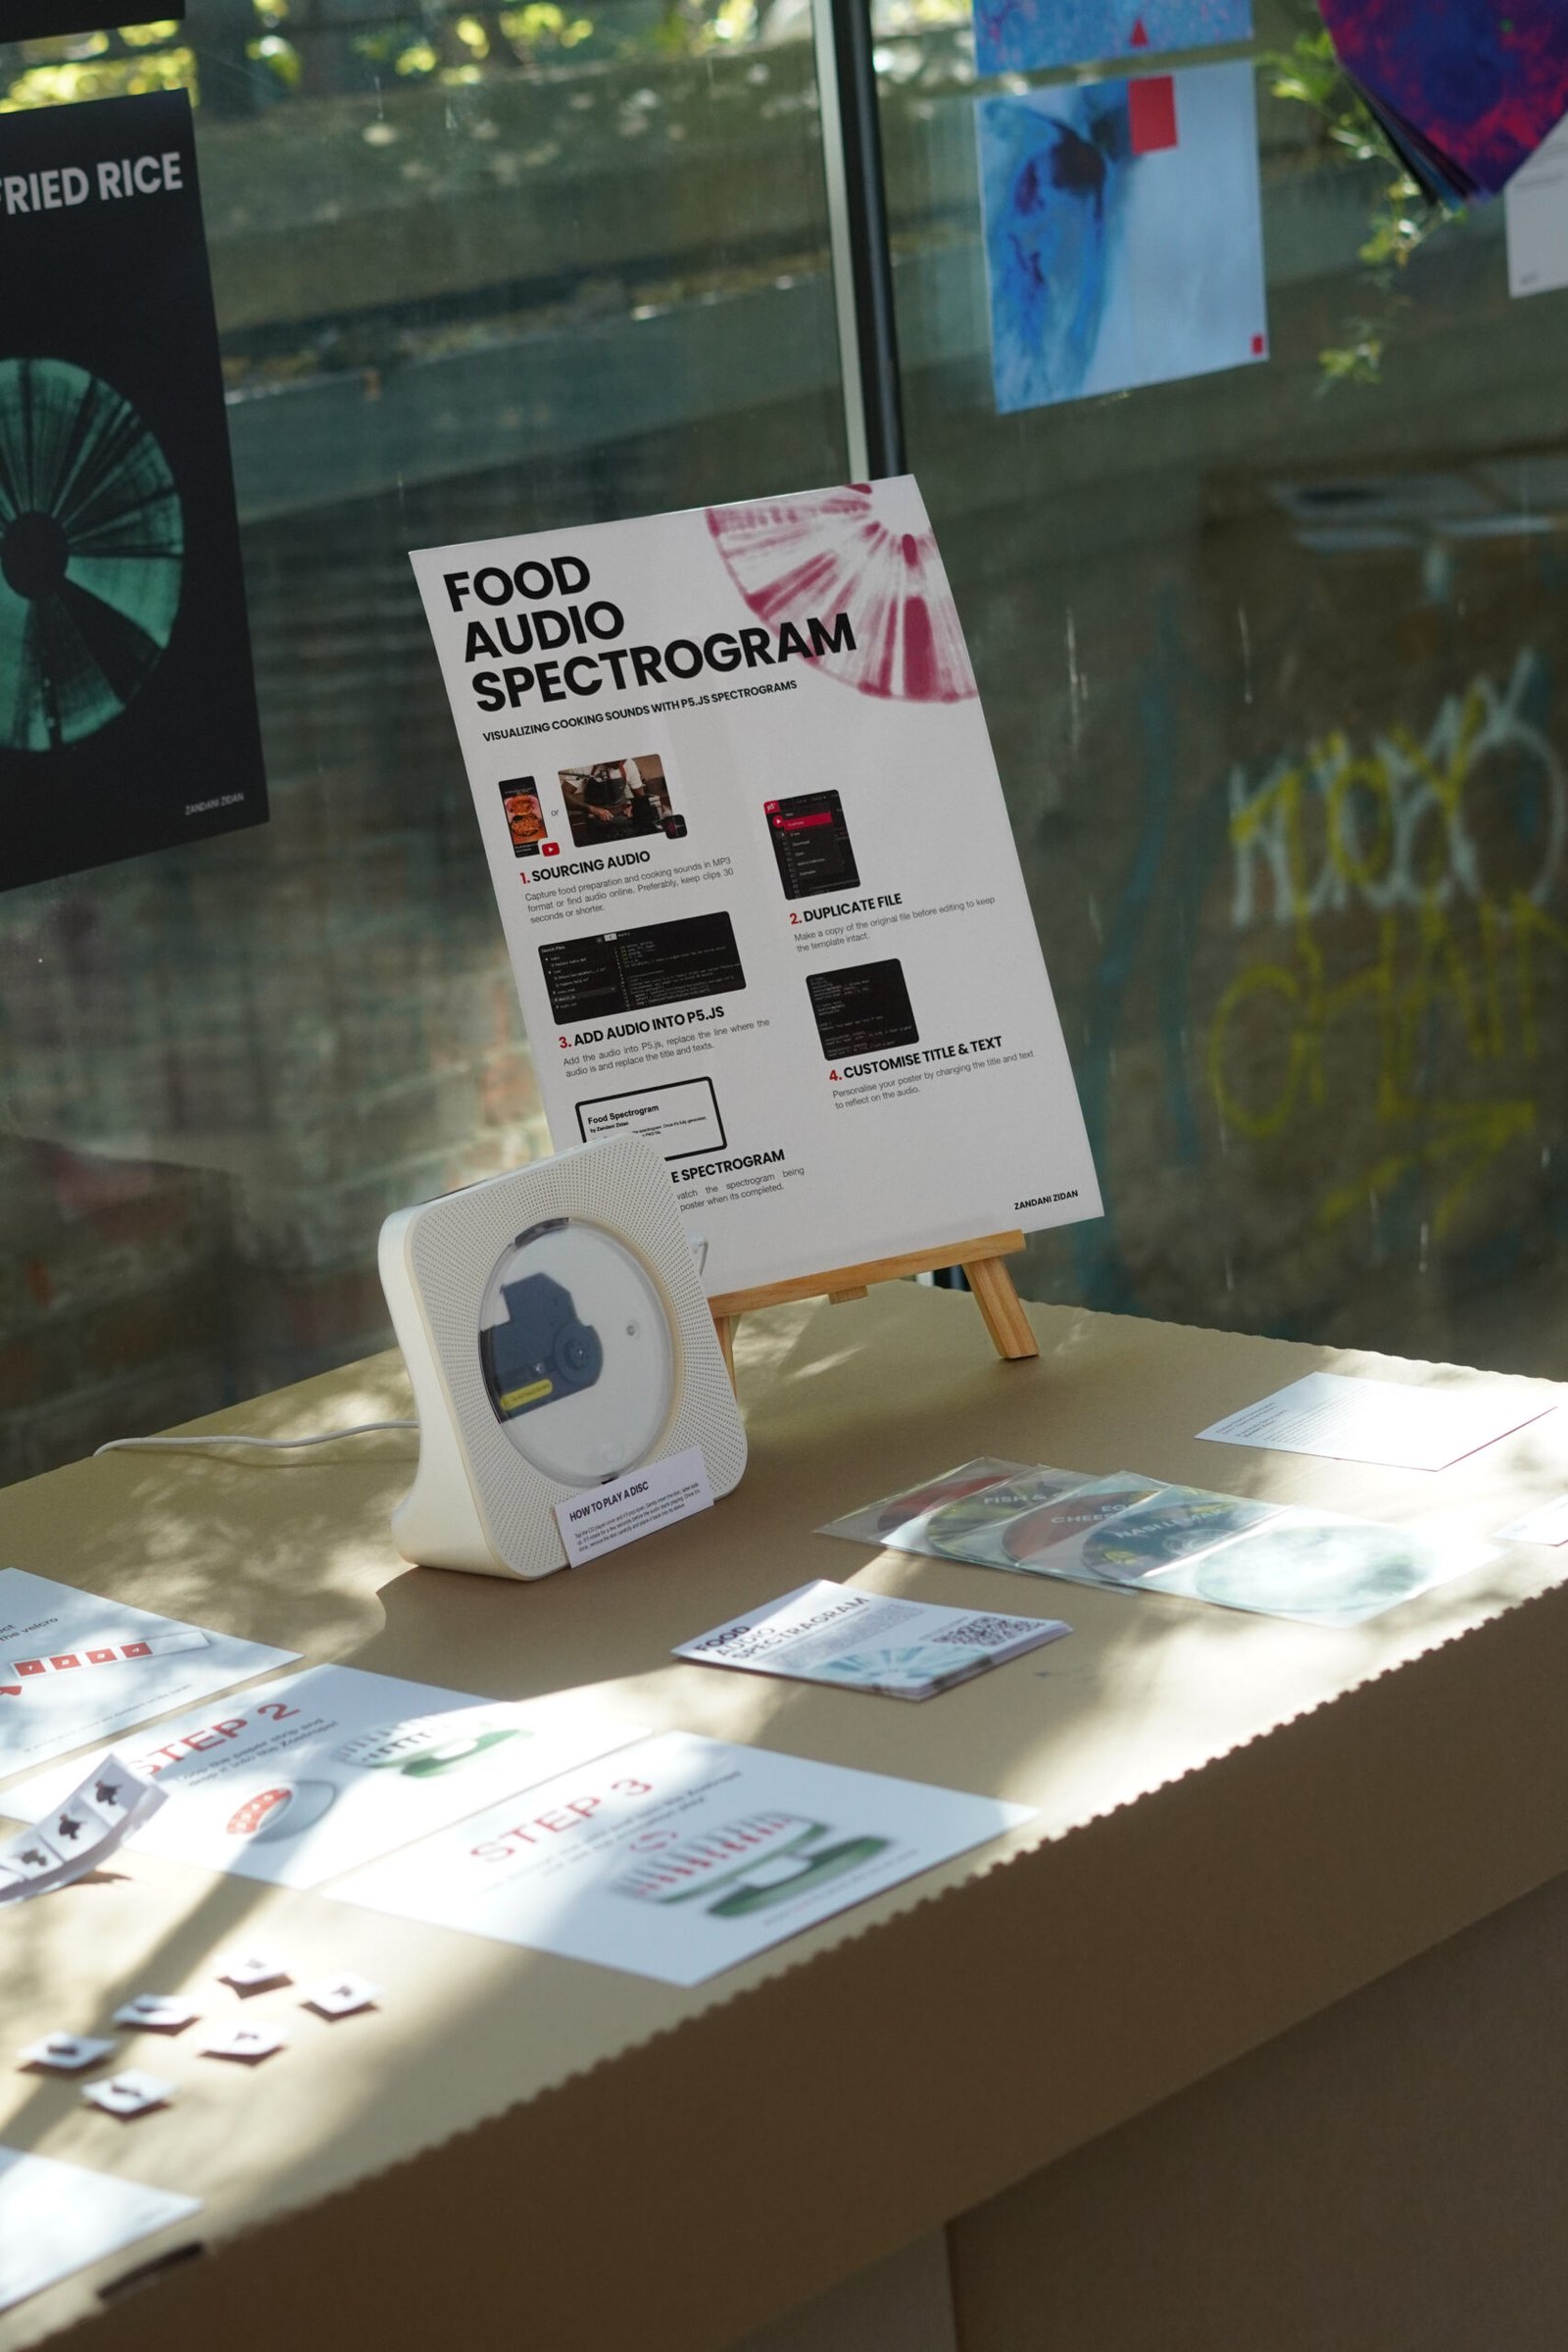
This project is part of a class assignment where we were free to explore any concept, as long as we documented and explained our creative process. I experimented with p5.js, using sound as input to generate dynamic, radial spectrogram visuals that I later refined into poster designs.
The goal wasn’t to deliver a profound message but to show that coding can be fun, creative, and visual, especially for those who usually find it intimidating or too technical. Think of it as data art for curious beginners.
Problem
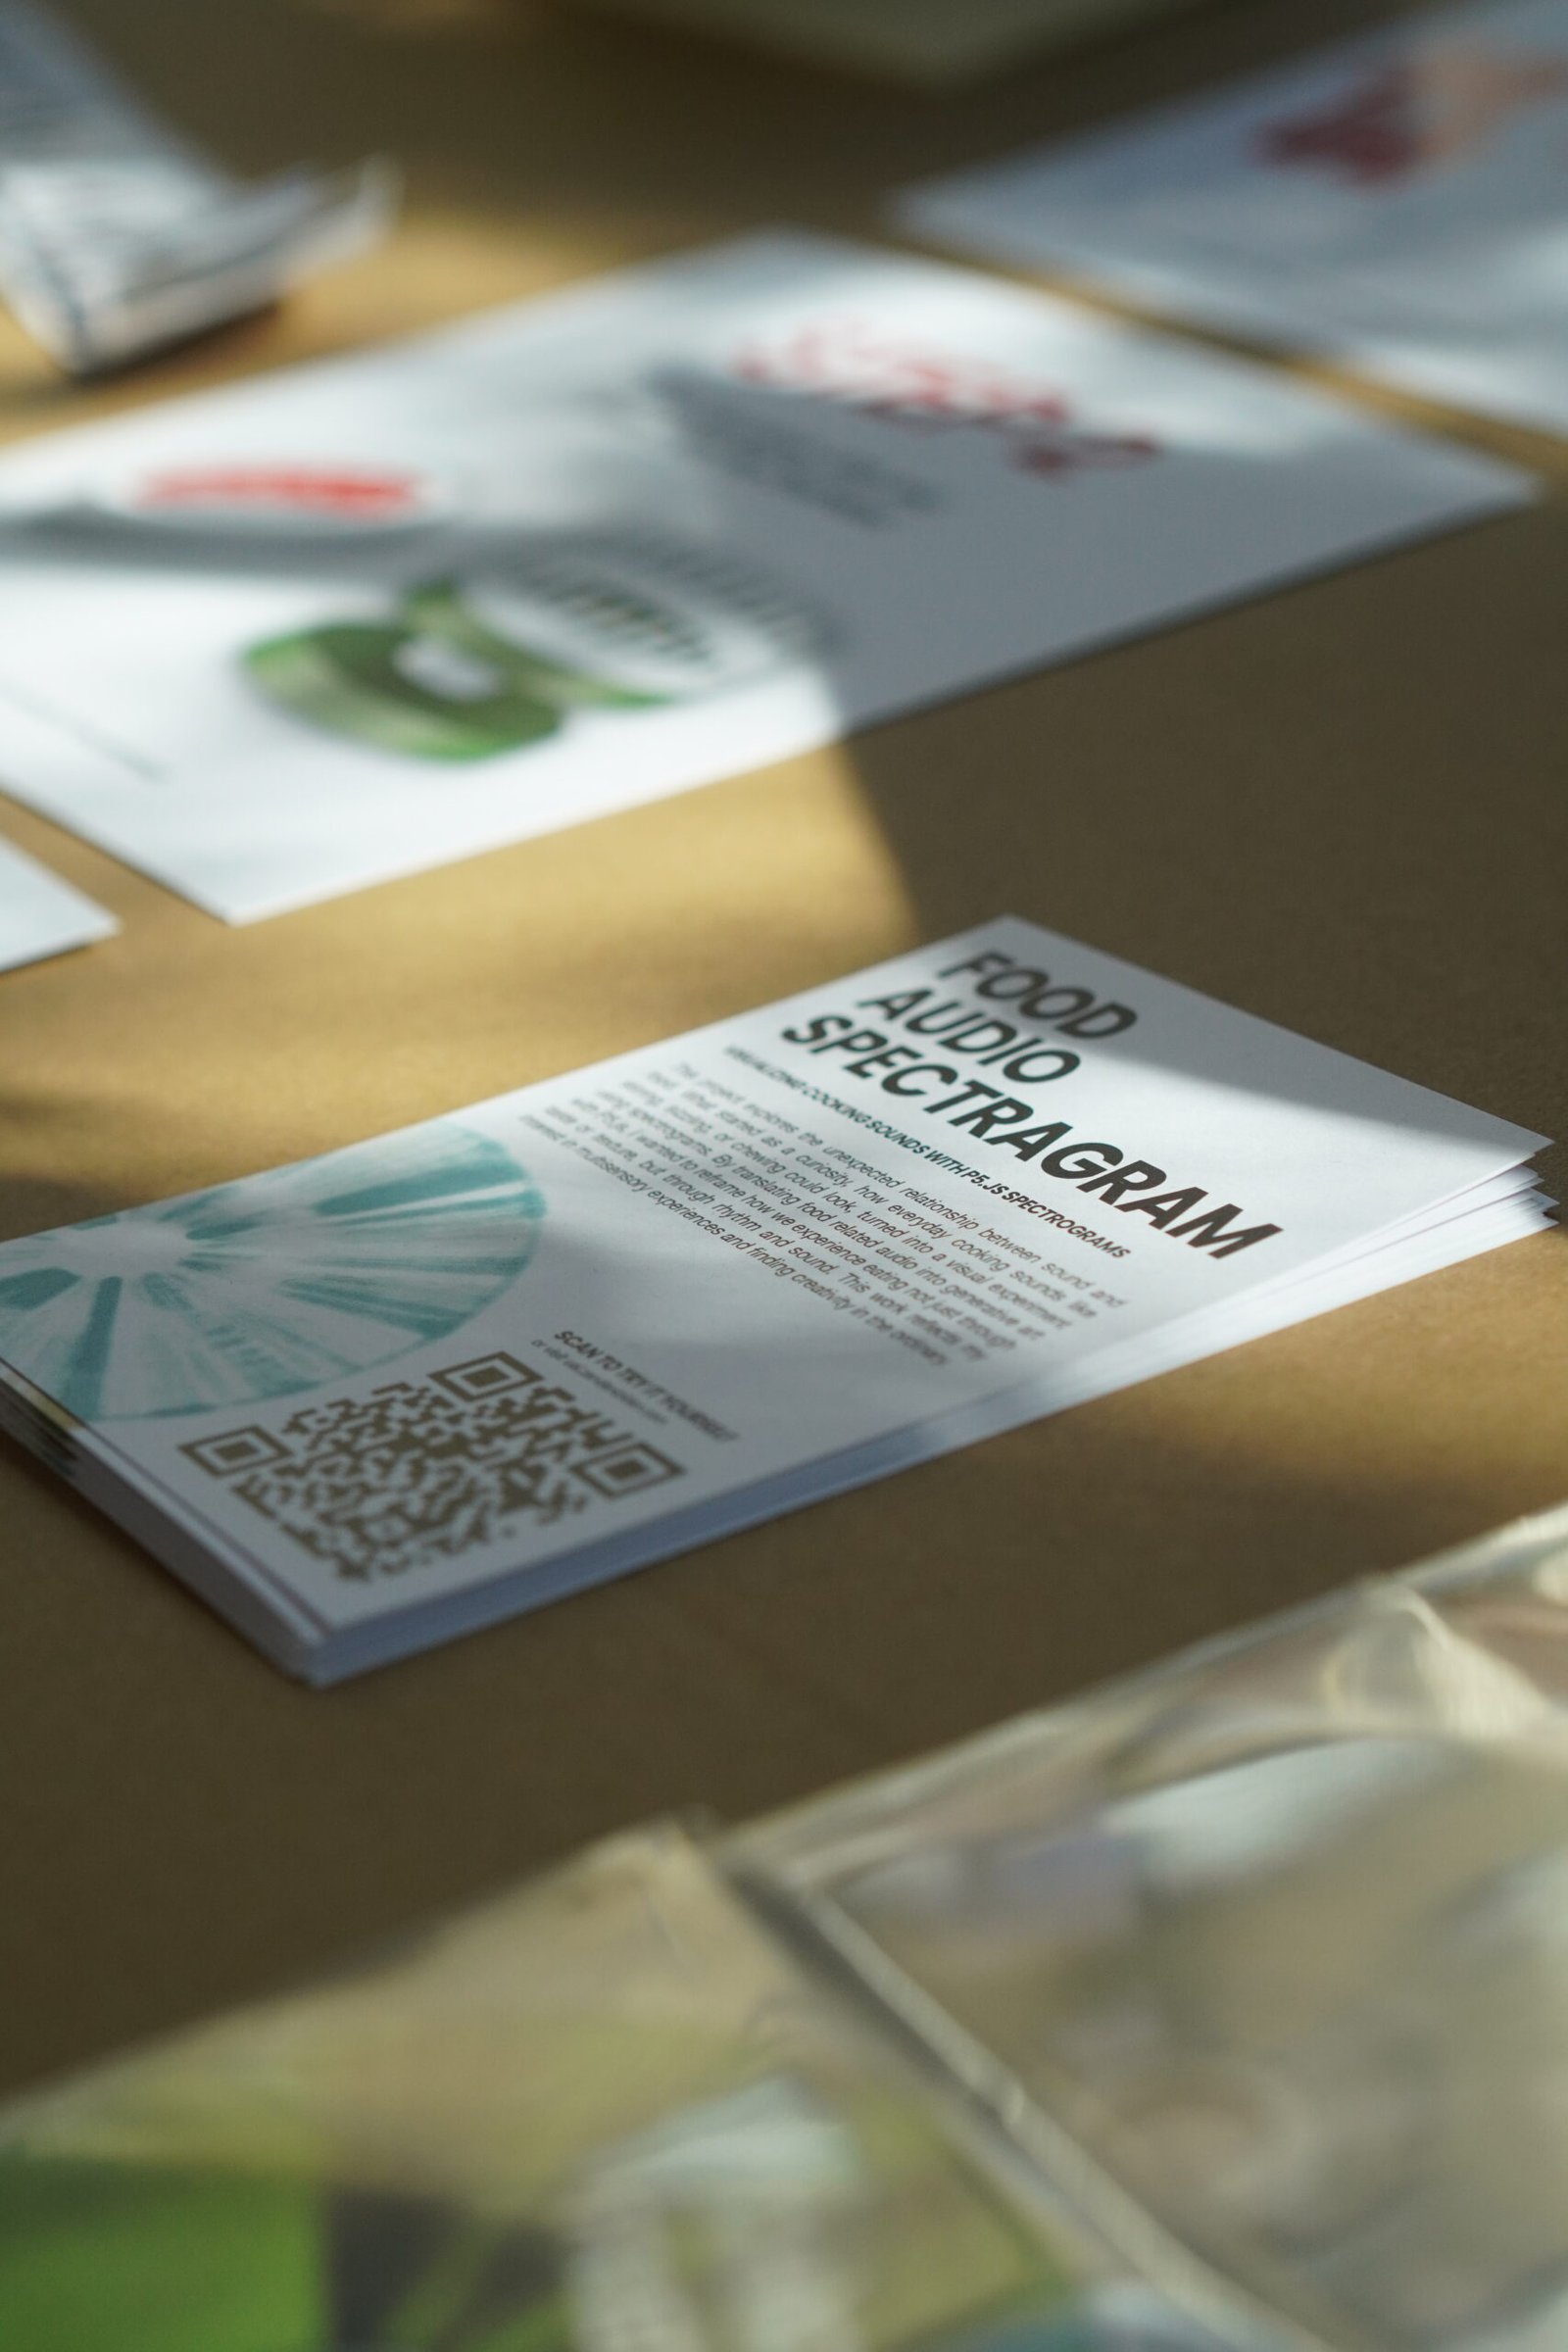
Creative coding often feels inaccessible to designers or artists who aren’t from a technical background. Many assume programming is strictly functional, not expressive. I wanted to challenge that idea and use code to create something beautiful, intuitive, and approachable, starting with sound.
Solution
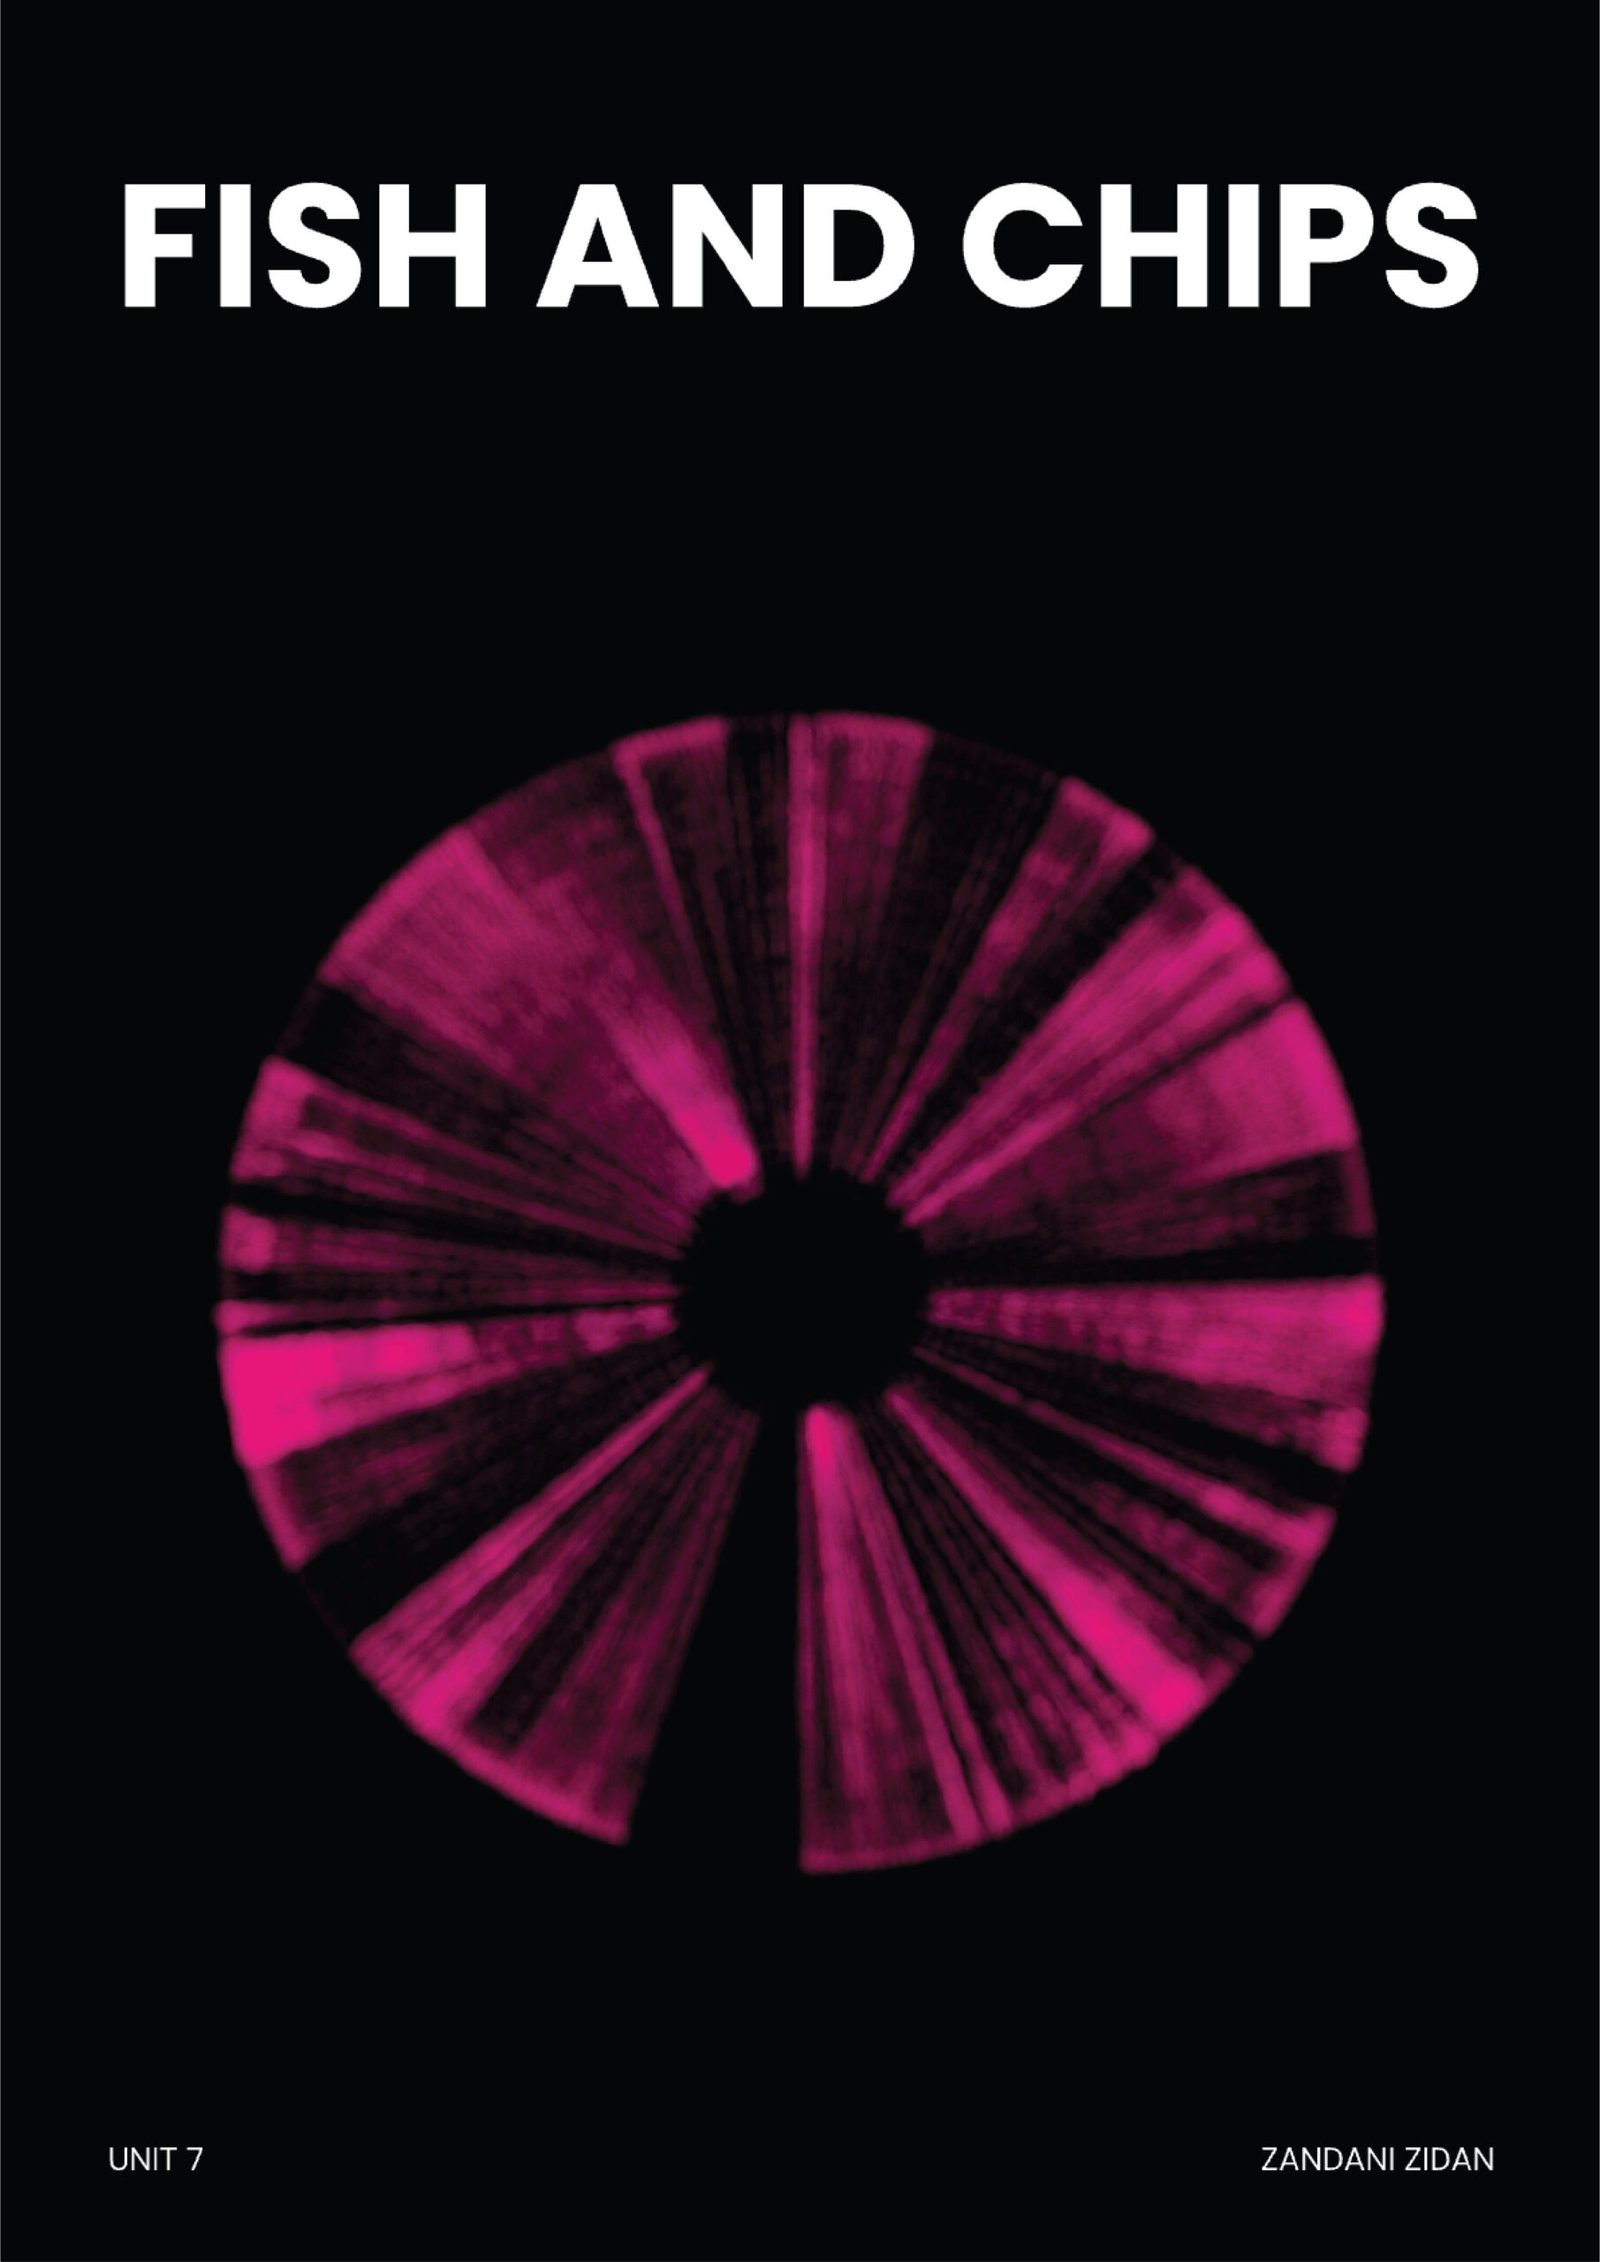
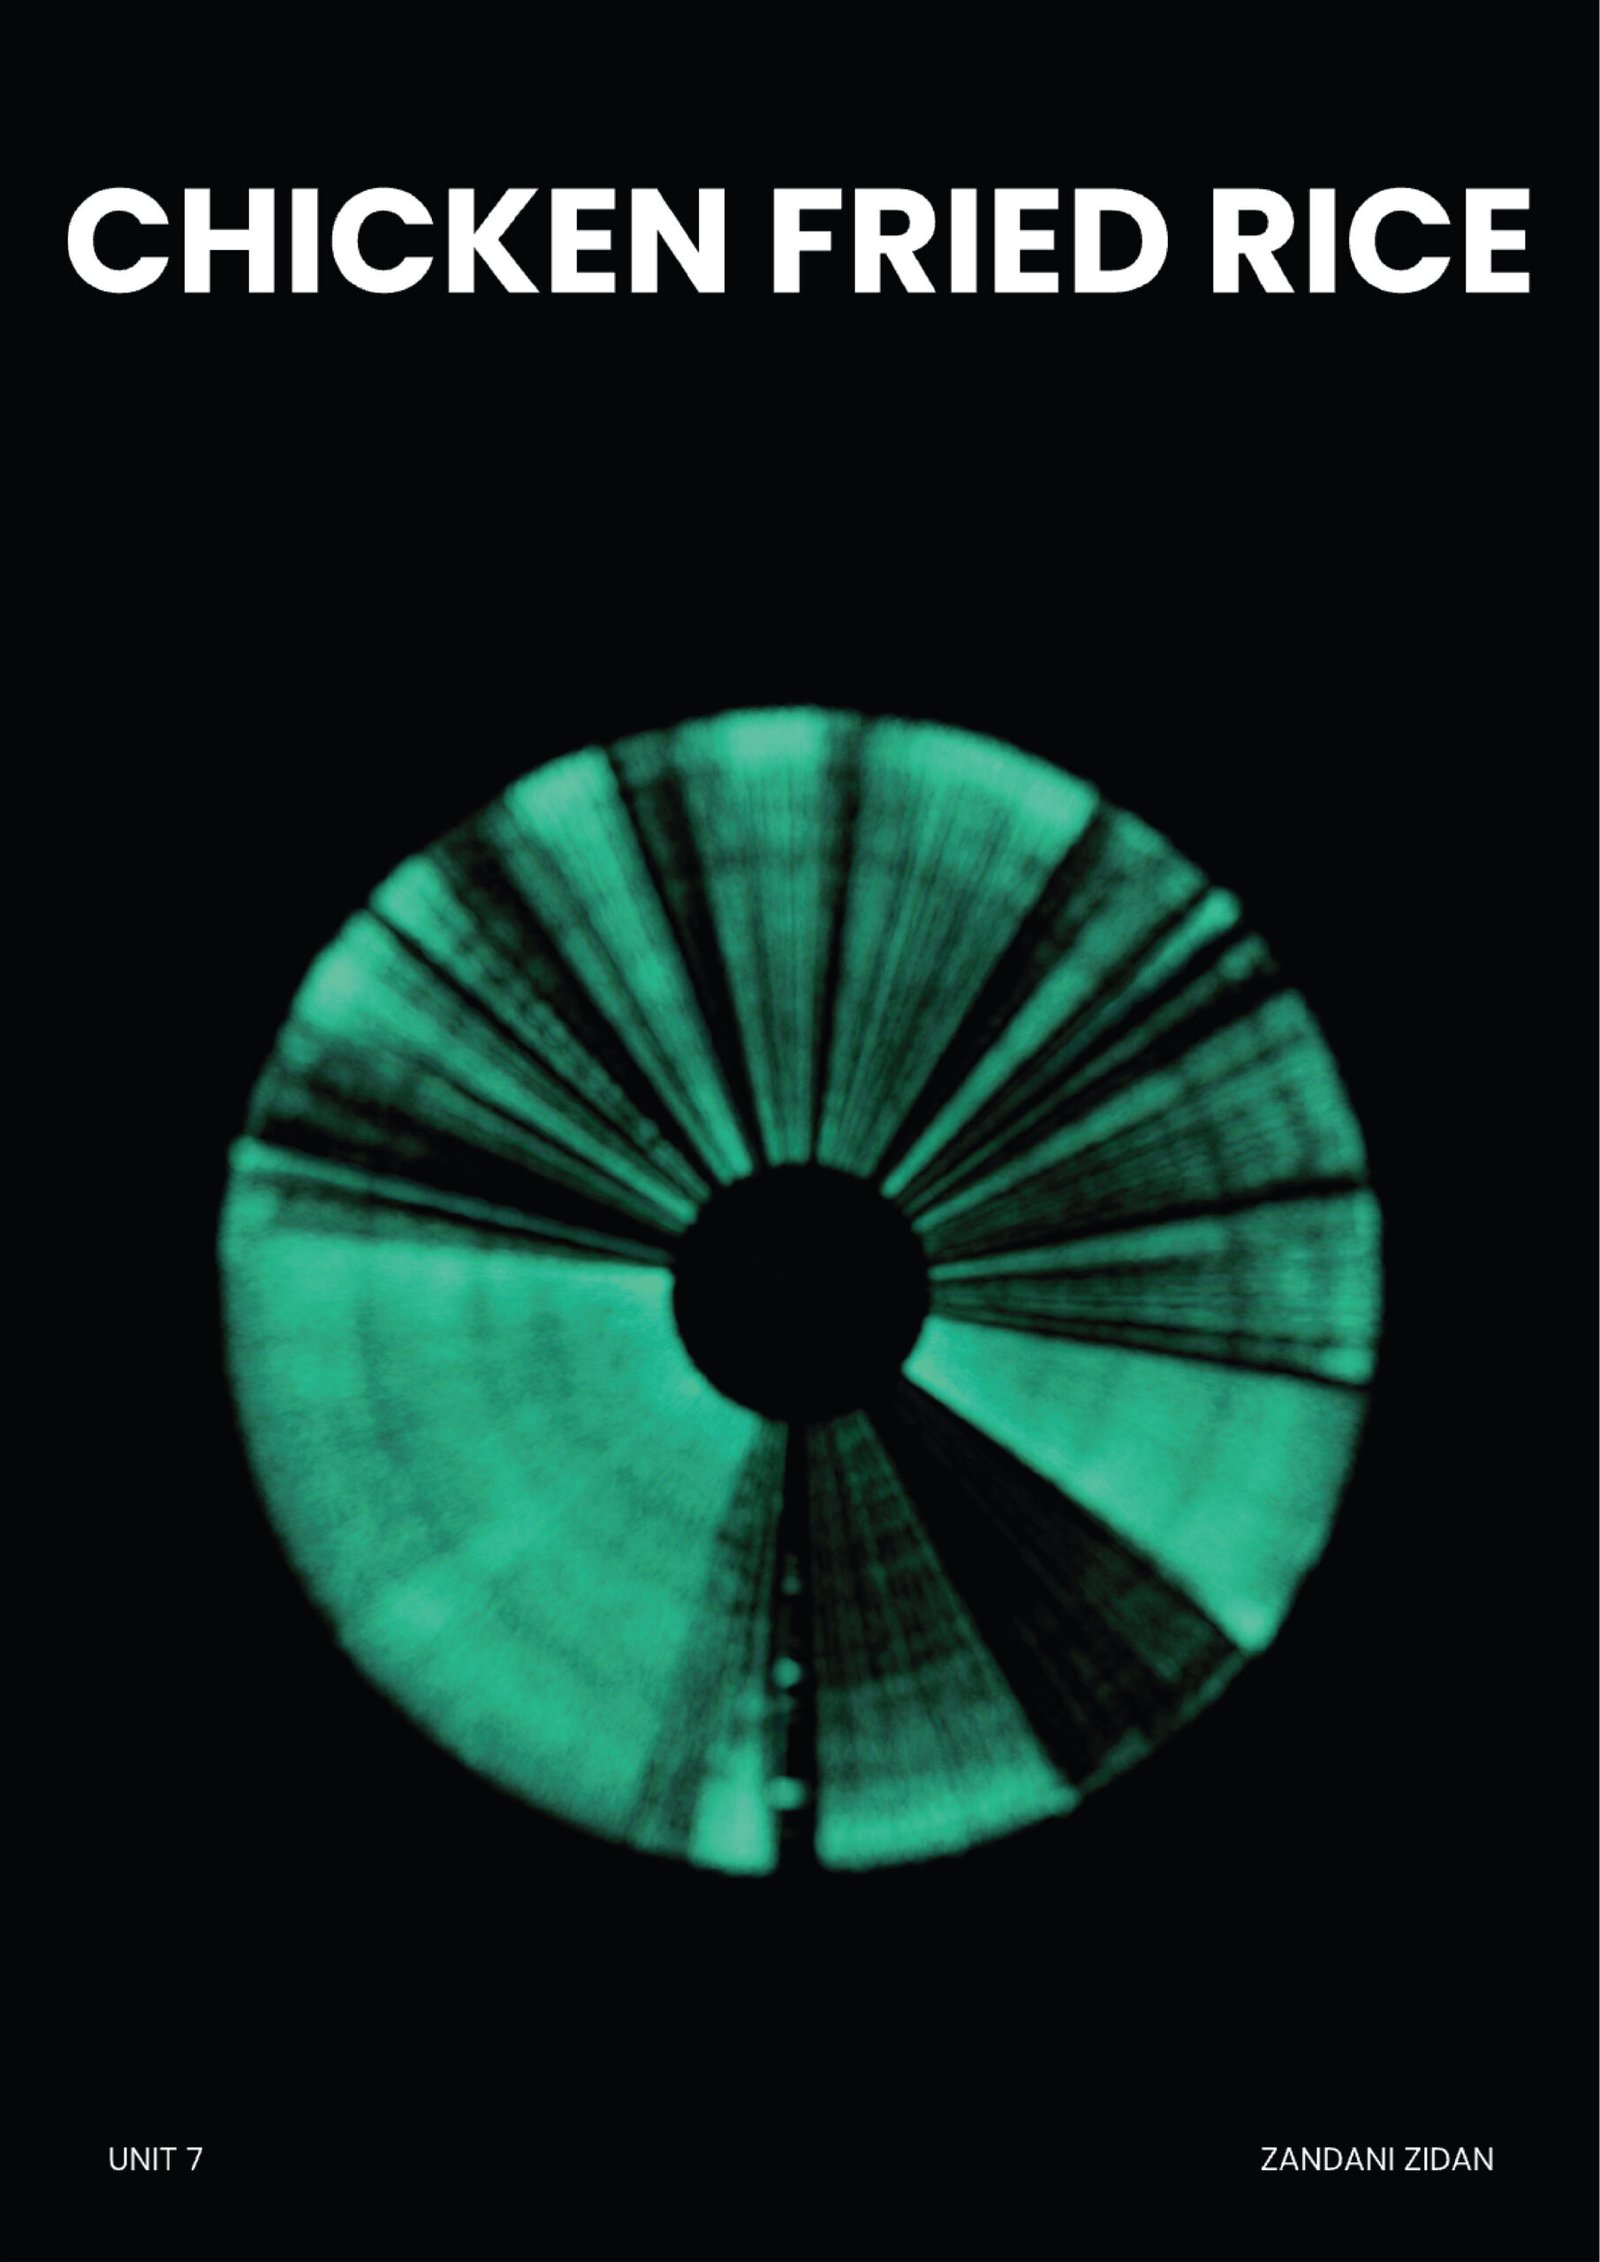
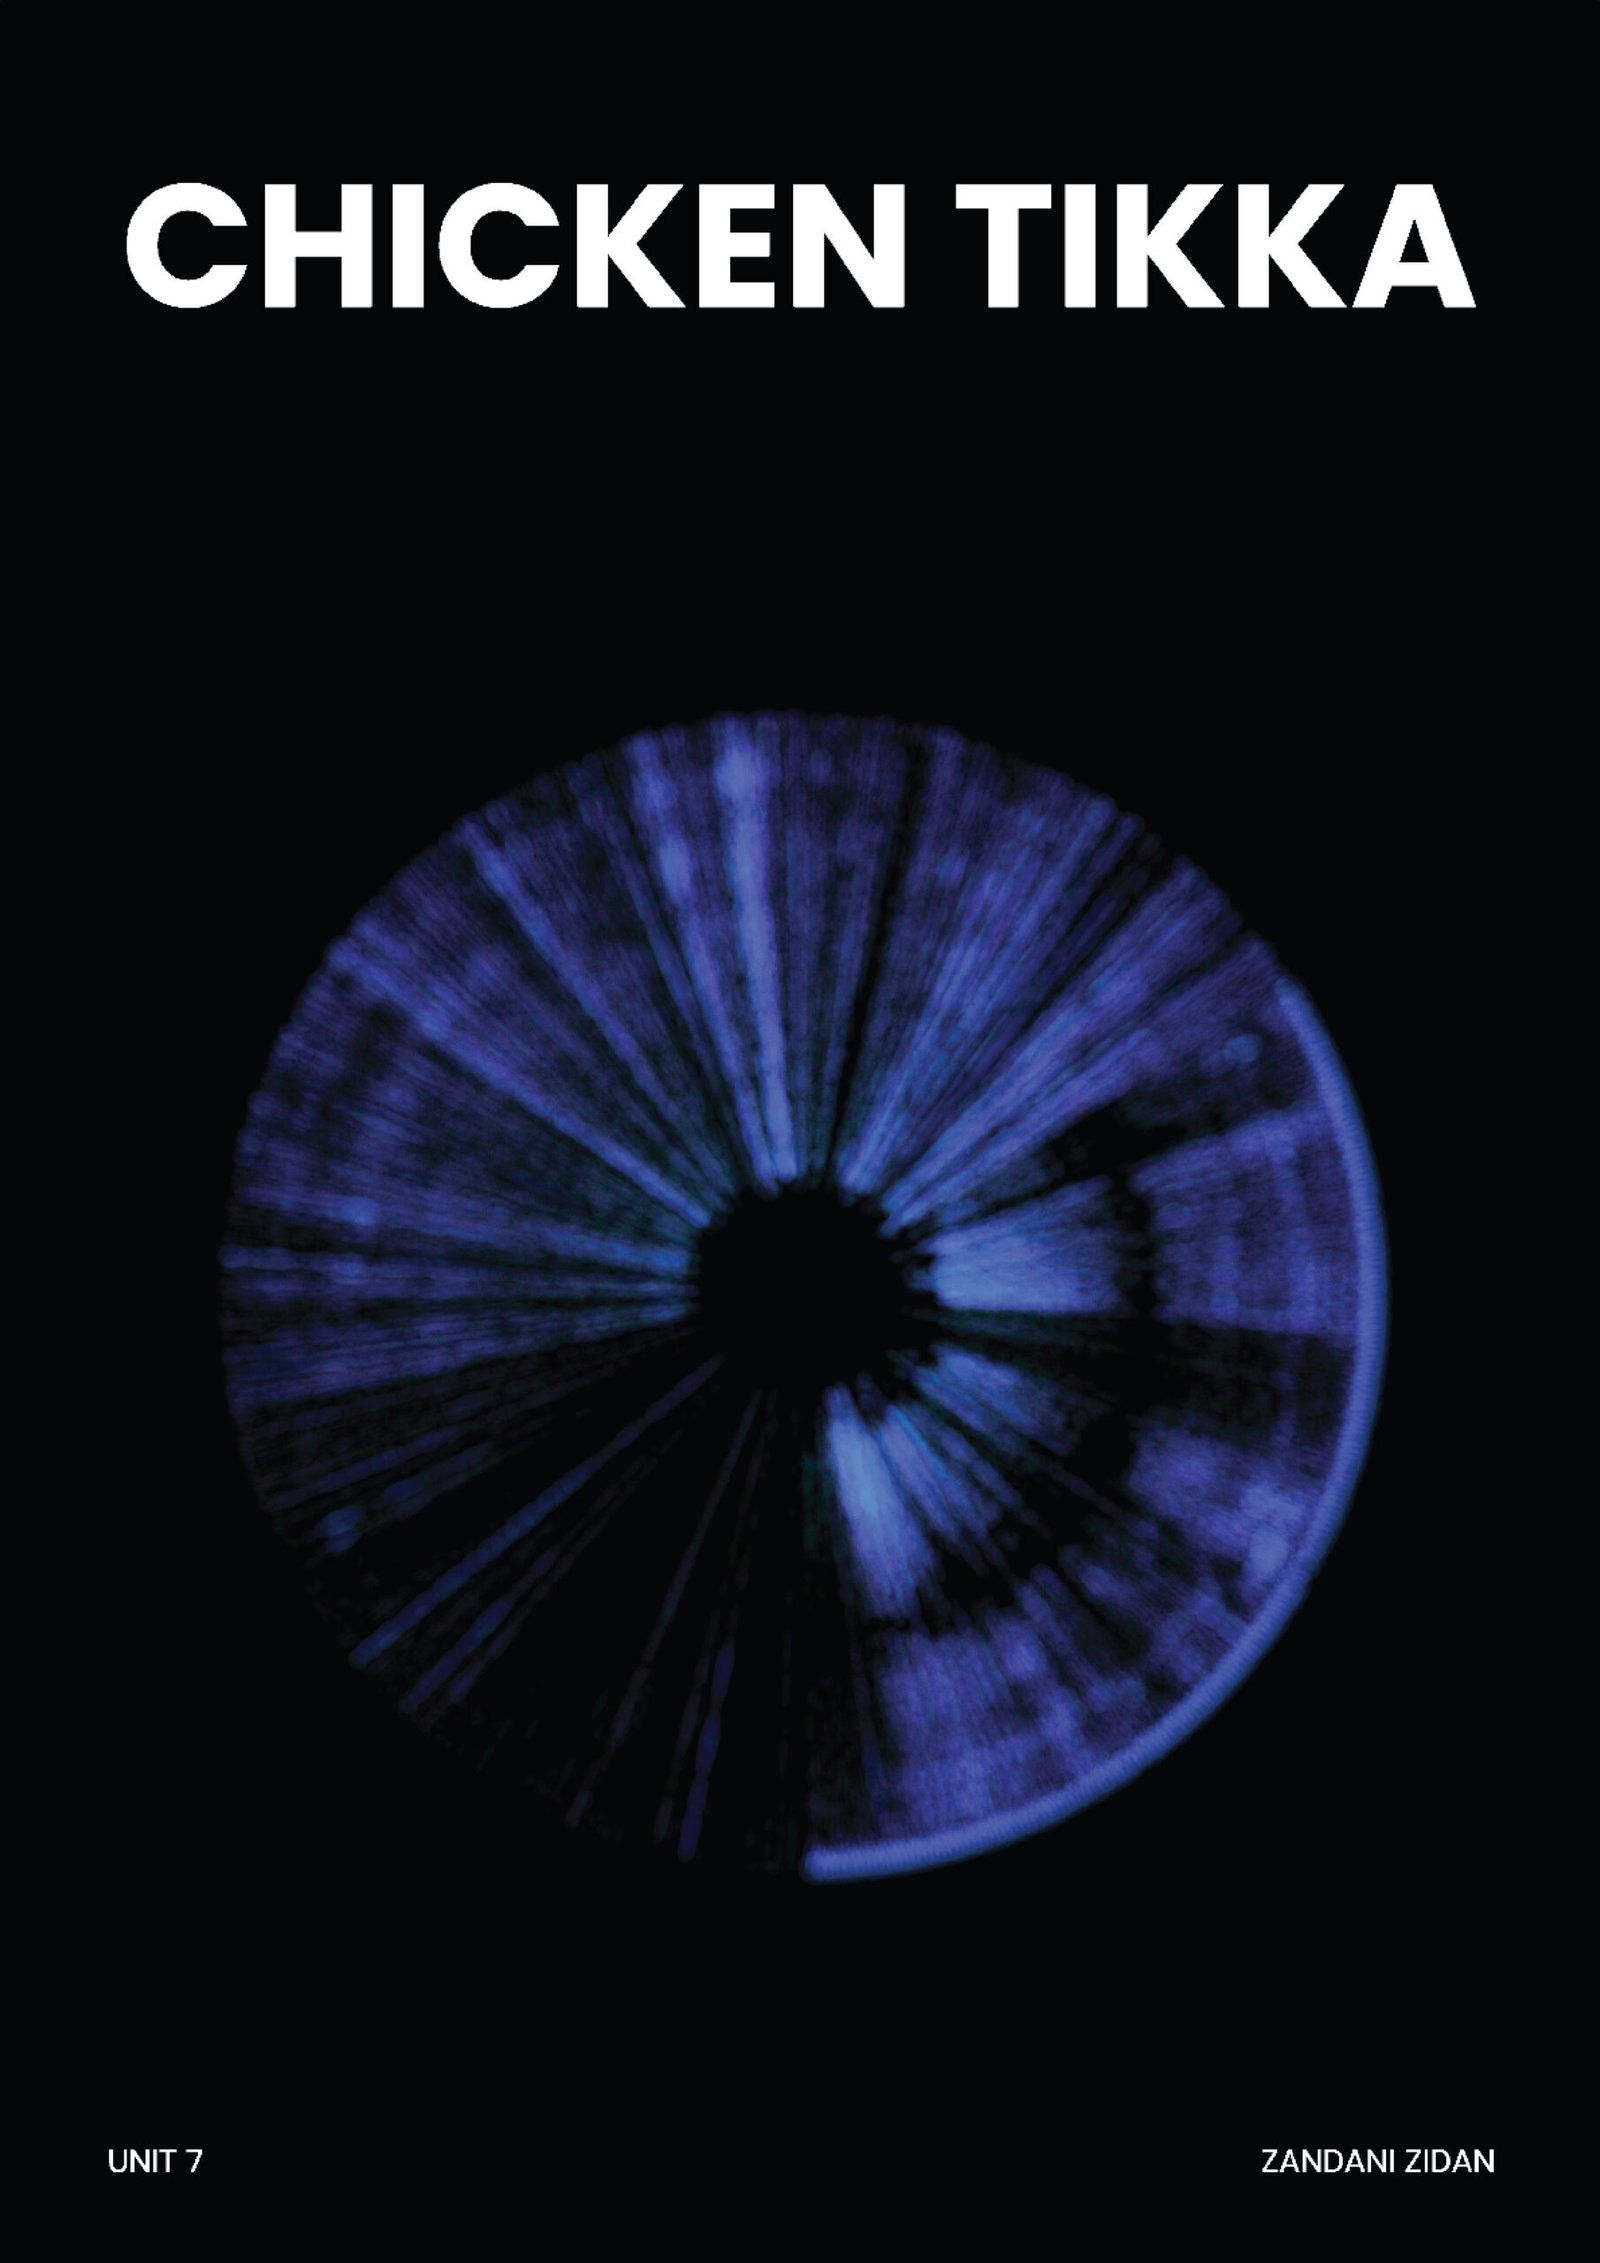
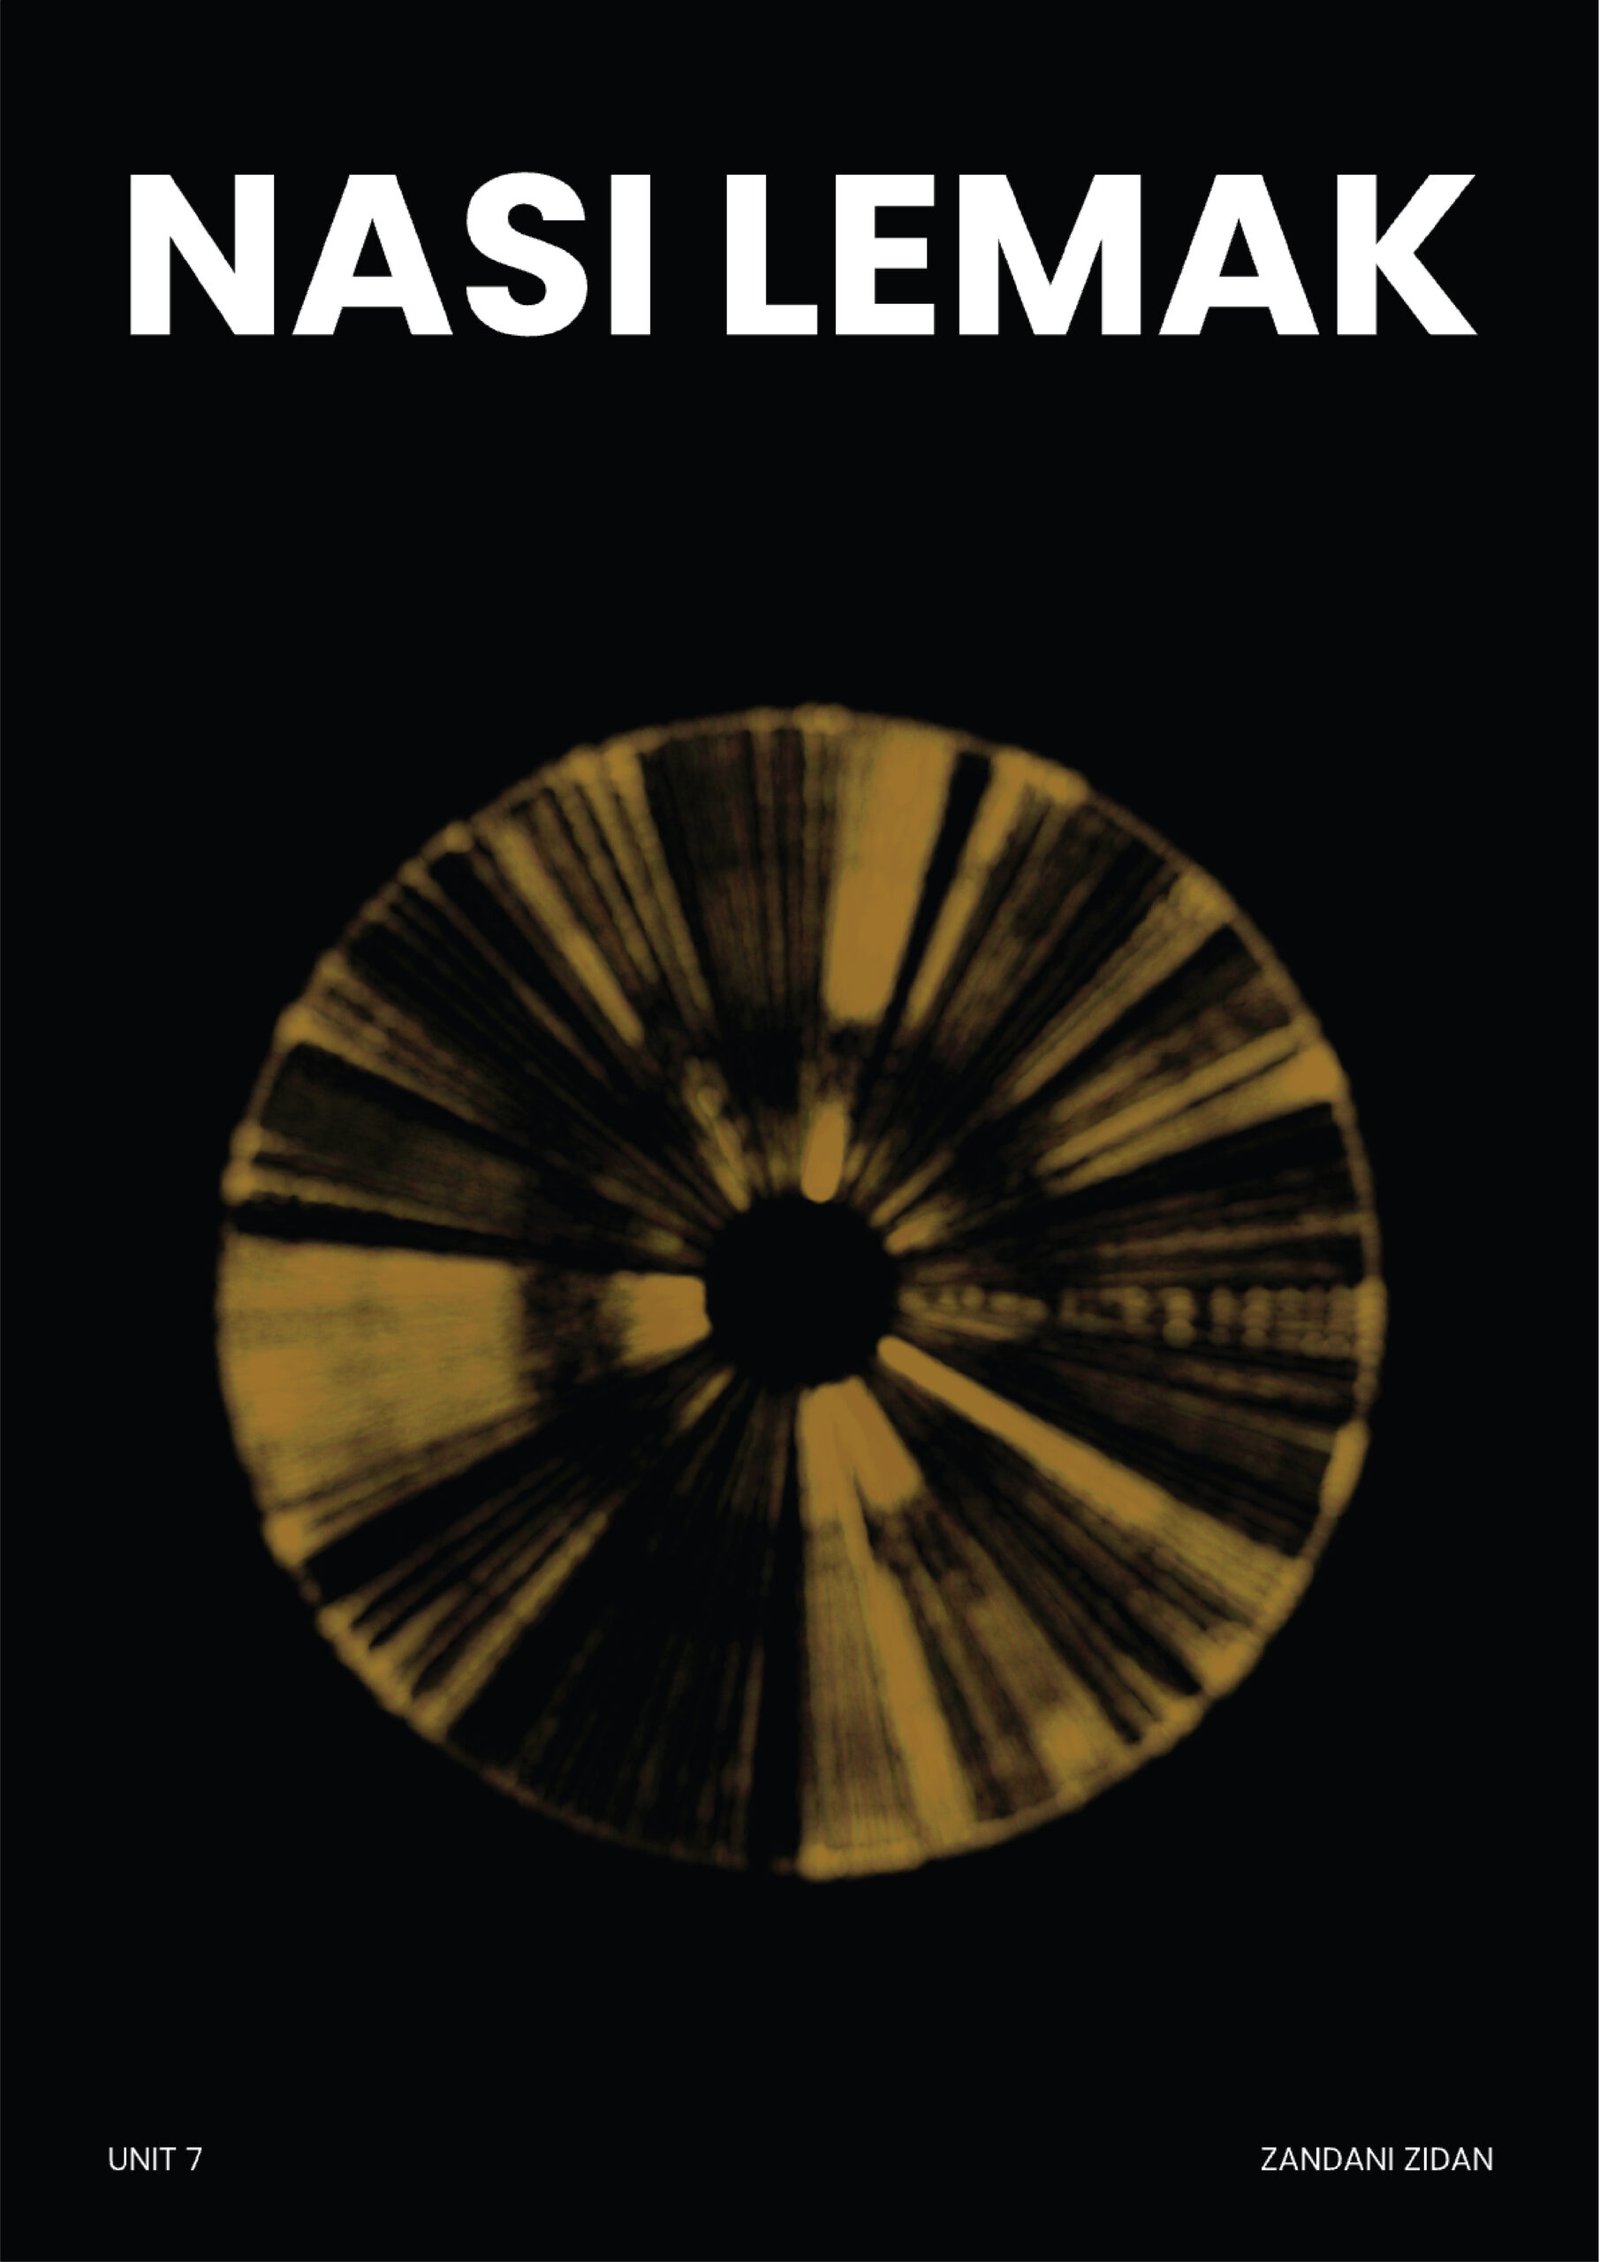
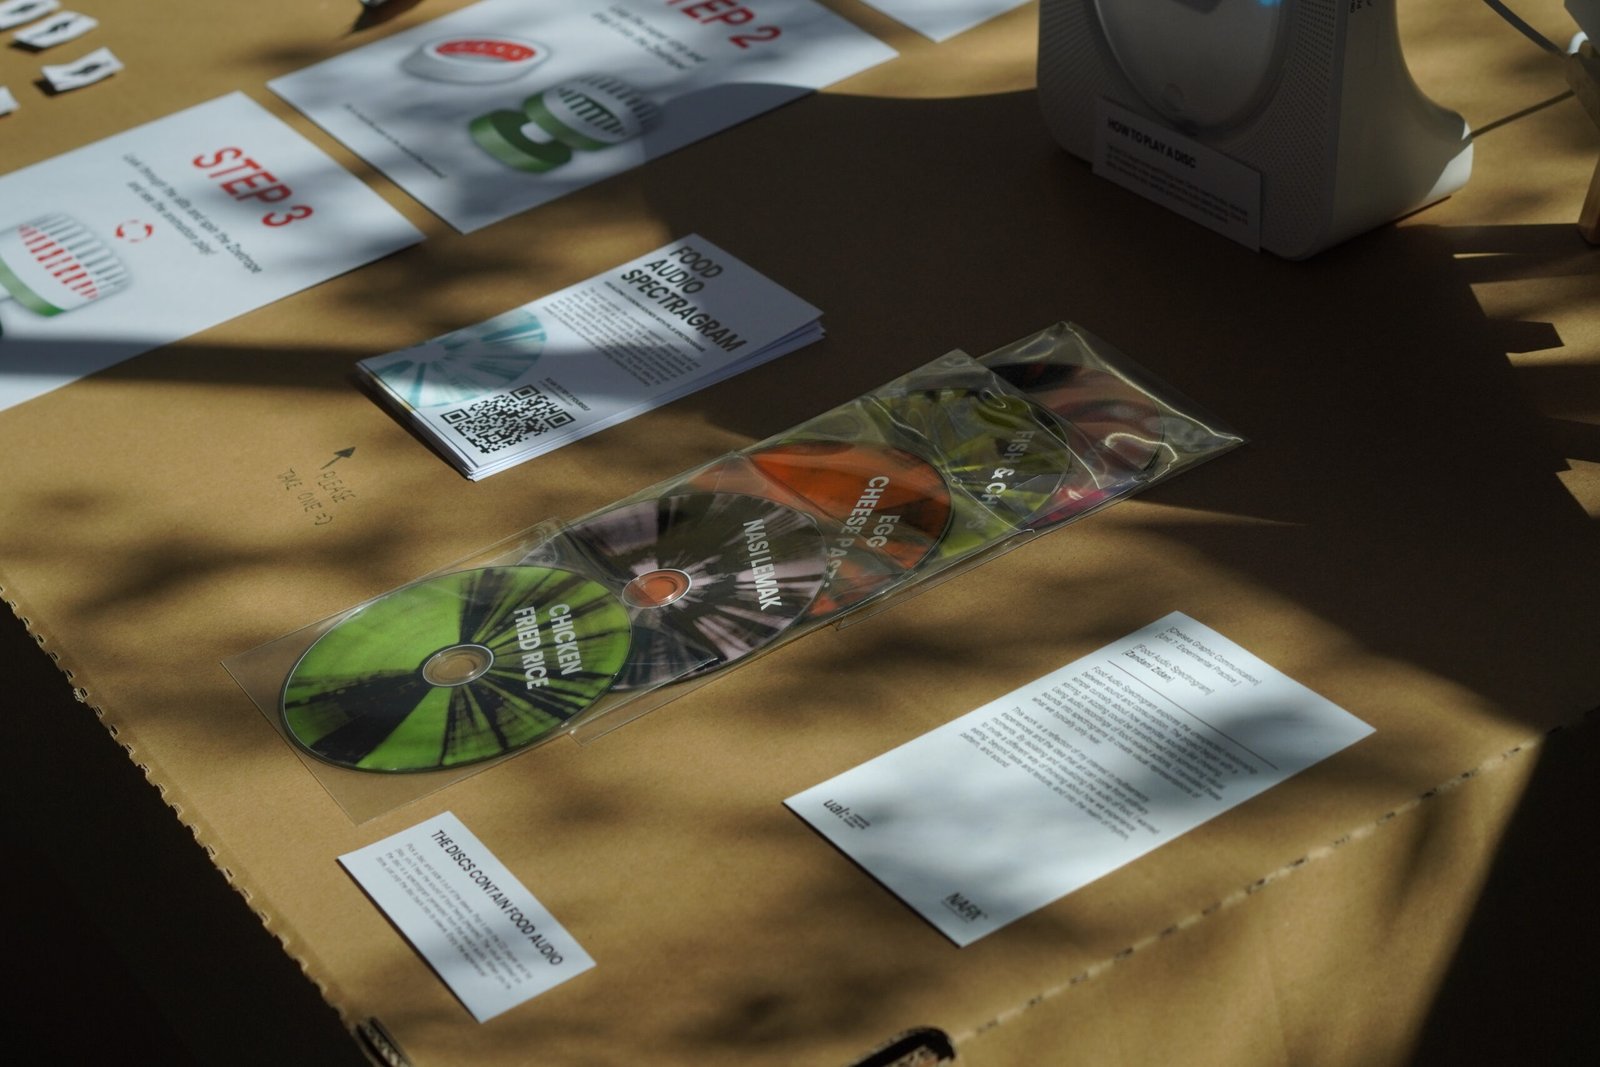
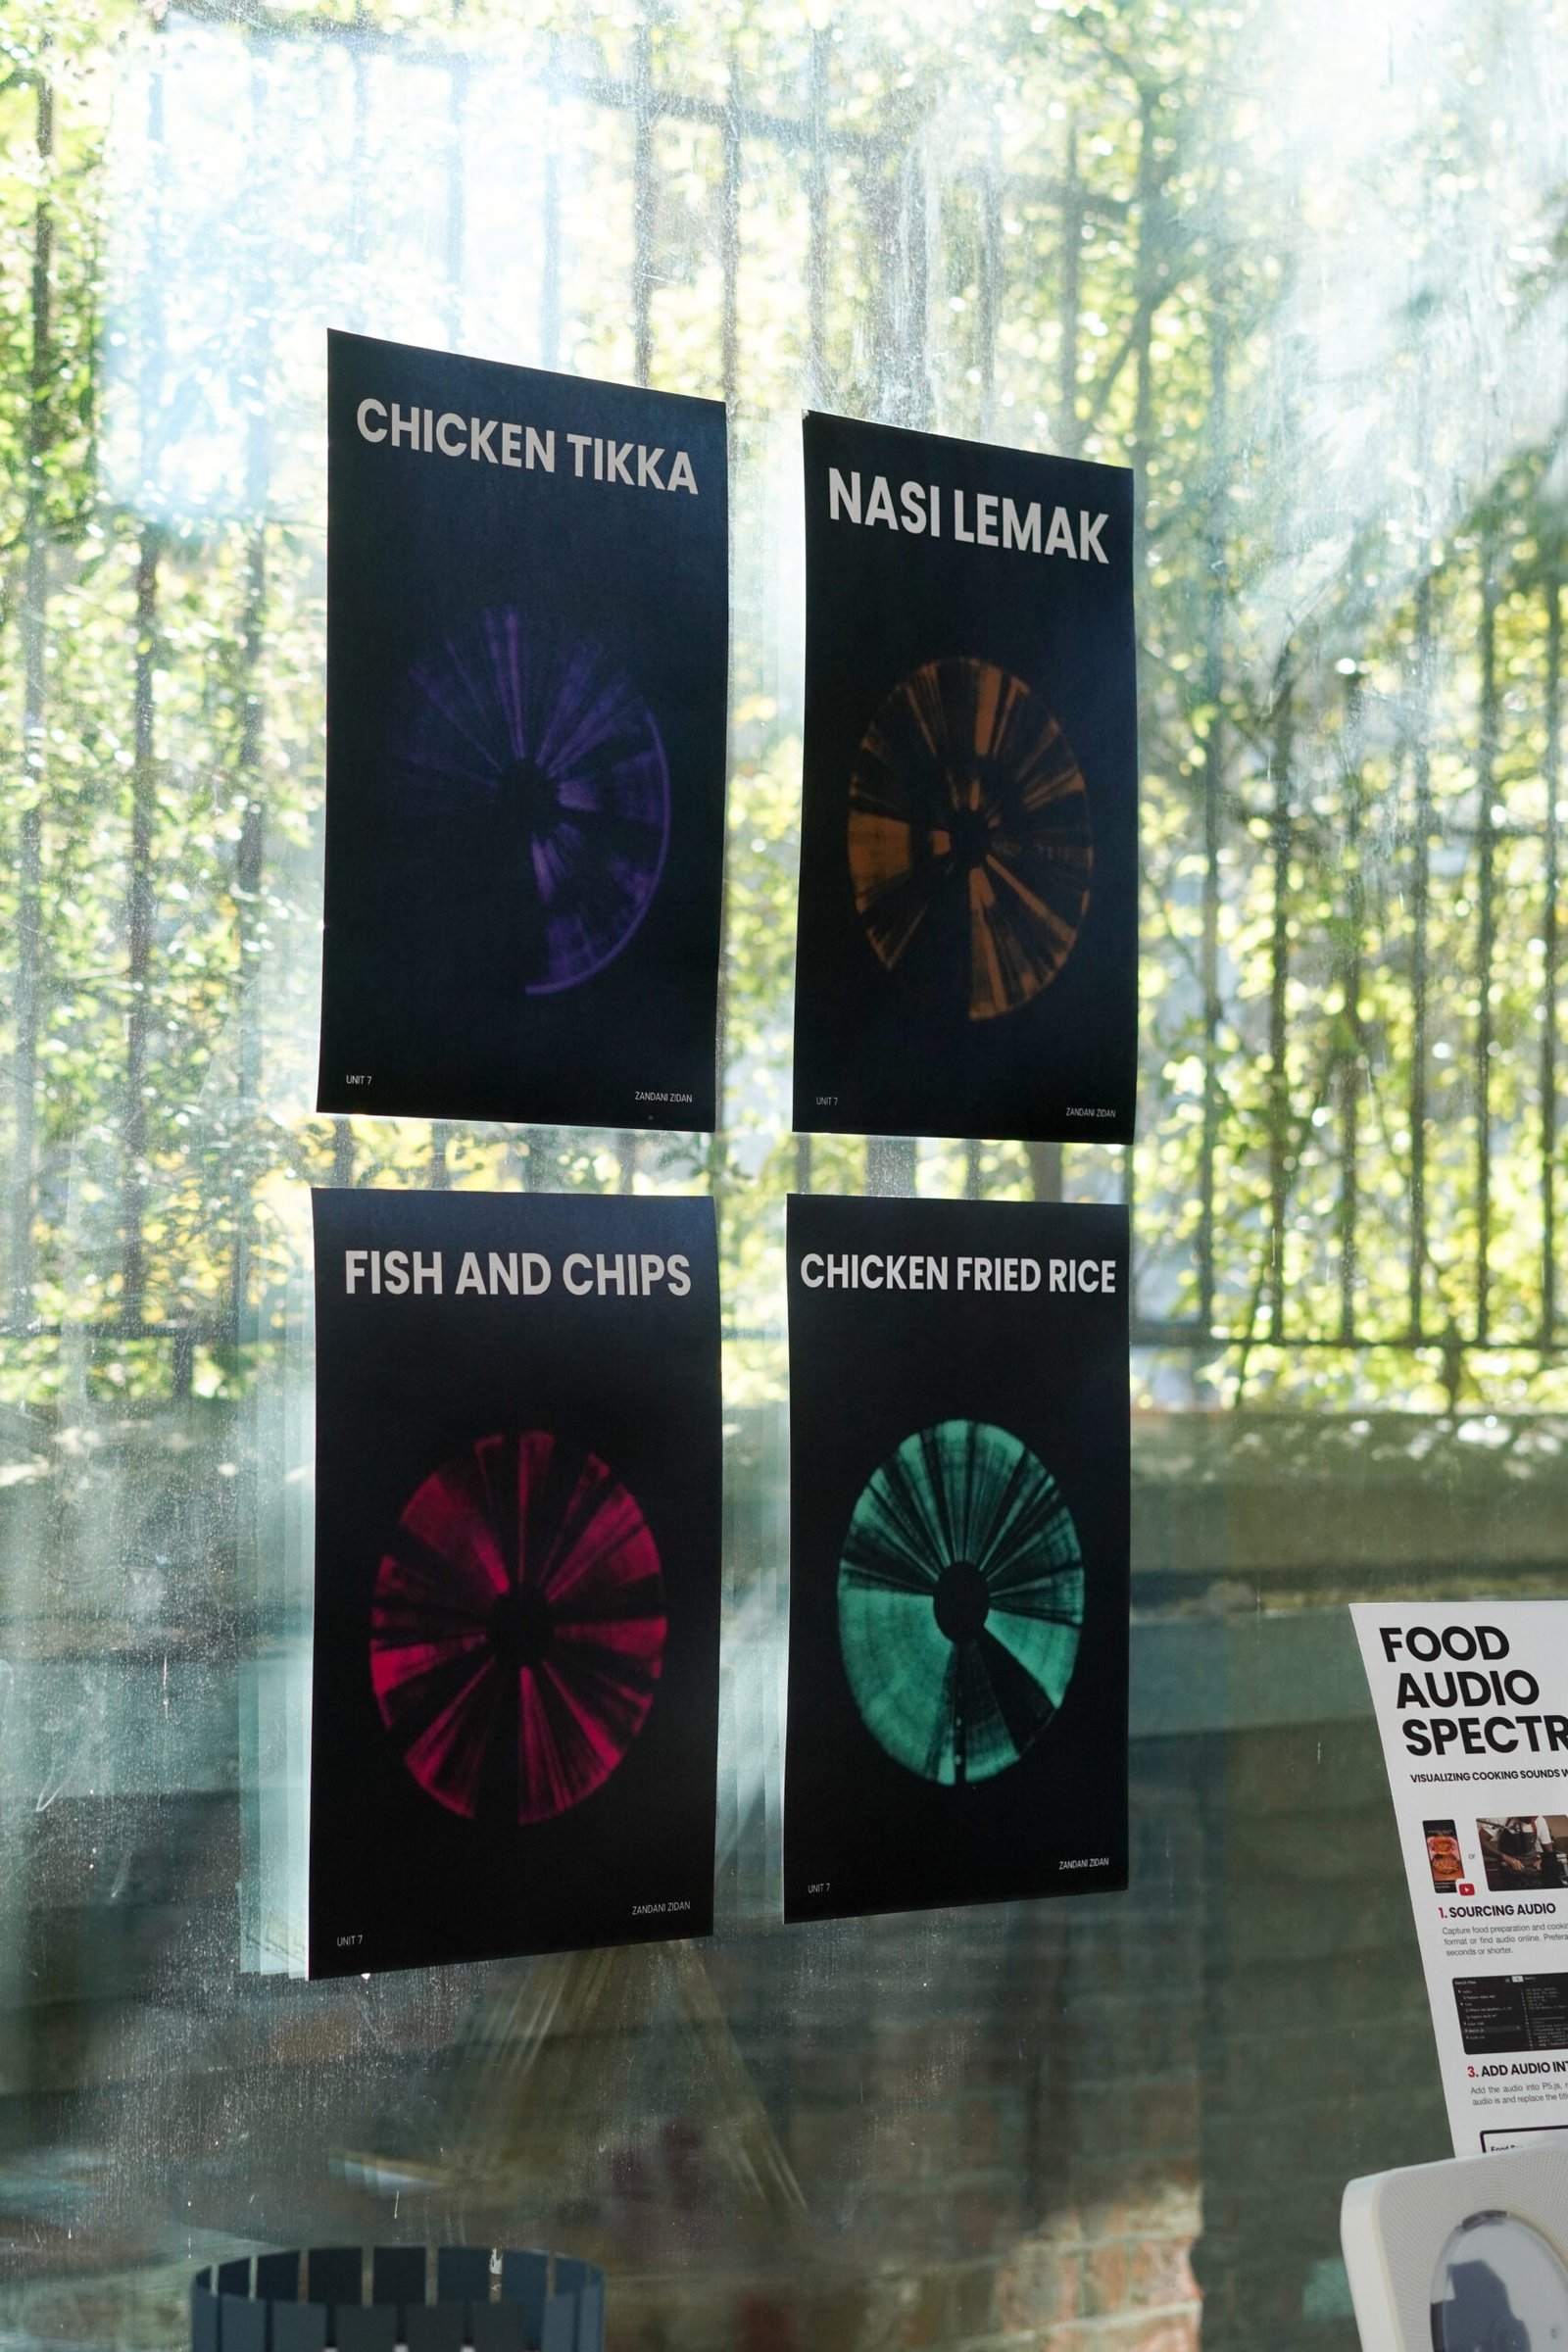
I used p5.js, a JavaScript library built for visual creatives, to make a custom sketch that processes audio files and maps their frequency spectrum into circular visual forms. Each audio file produced a unique “spectrogram fingerprint,” which I then exported and polished into high-resolution posters.
The project showed how sound data can become a design tool, and how generative visuals can turn invisible elements (like audio frequency) into something striking and physical.
The final output: a series of minimalist posters, visually clean, centred, and driven by rhythm, designed to spark curiosity about the creative side of code.